- Example active heading
- Example heading
Executive summary
The Lendio SMB Lending Index is a measure of how accessible capital is to small business borrowers. Lendio analyzes the business profiles of over 14,000 business owners who receive funding offers through our marketplace quarterly, and compares average credit score,* monthly revenue, and time in business of every company that received a financing offer against a framework informed by historical averages.
Every quarter, in parallel to this analysis, we survey both SMB lenders and borrowers to better understand the dynamics influencing accessibility to capital for small businesses, and provide insight into what lenders are anticipating the market will see in the following quarter.
Key Insights
- More small businesses are entering the lending ecosystem, but satisfaction remains mixed. 51% of SMBs had never applied for financing before coming to Lendio, and 58% reported never having received funding. Among applicants, only 35% were satisfied with the options they were offered (prior to applying with Lendio), and 24% received no offers at all.
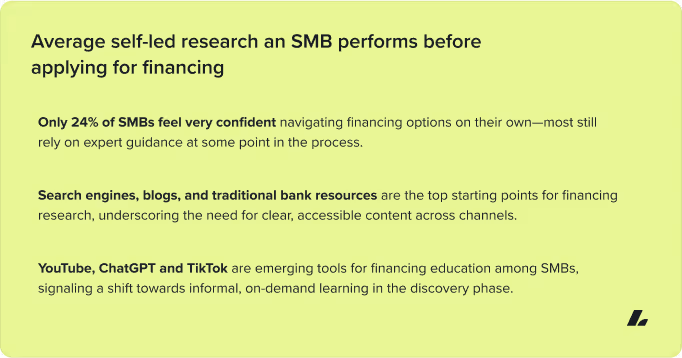
- Only 24% of SMBs feel very confident navigating financing independently, and 43% rely on expert guidance after applying. Blogs, search engines and bank content remain top research tools, but informal sources like YouTube and ChatGPT are increasingly influencing early decision-making.
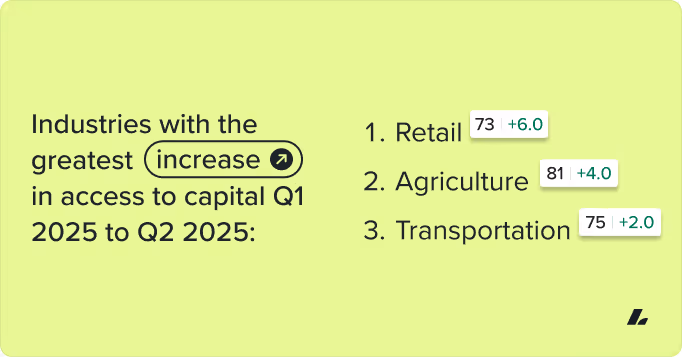
- The healthcare, construction, and ecommerce industries saw the greatest decline in access to capital. Retail, agriculture and forestry, and transportation experienced the most notable improvements. All industries measured saw an increase in credit score requirements in Q2 2025.
- Idaho led all states in access to capital gains in Q2 2025, scoring 11 points above the national benchmark. South Dakota, Texas, and Florida saw the largest declines in access to capital.
Lendio SMB Lending Index Score: 69 (-4)
Q2 2025
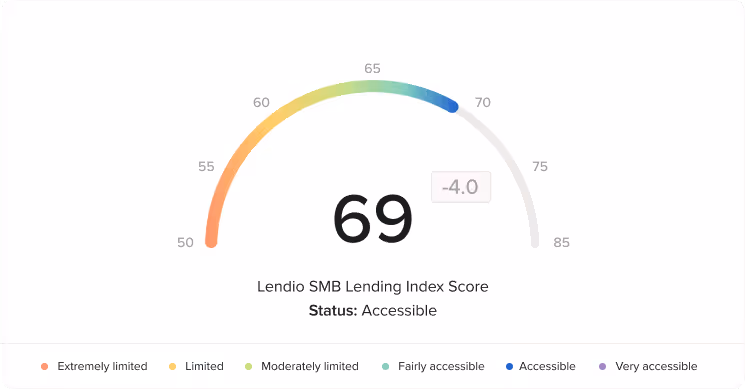
Q1 2025 score: 73
Lendio’s SMB Lending Index declined from 73 in Q1 2025 to 69 in Q2 2025, signaling a moderate decline in small business access to capital. This shift reflects increased selectivity across more industry verticals, even as some credit criteria broaden at the aggregate level. While average credit score, revenue, and time in business requirements declined across the marketplace, credit score requirements rose in many industry verticals, and more sectors reported reduced access to capital compared to Q1.
Based on the feedback gathered from lenders and industry analysis performed, we anticipate the lending environment will remain stable, but more discerning through the next quarter.
What does the Lending Index Score mean?
Lendio’s SMB Lending Index measures how accessible business financing is to small business owners, with a higher score indicating greater accessibility. The score is based on the business profile of the 14,000+ small businesses offered financing in Lendio’s marketplace in a quarter. The report’s methodology section provides a full breakdown of how the score is calculated.
Credit Box
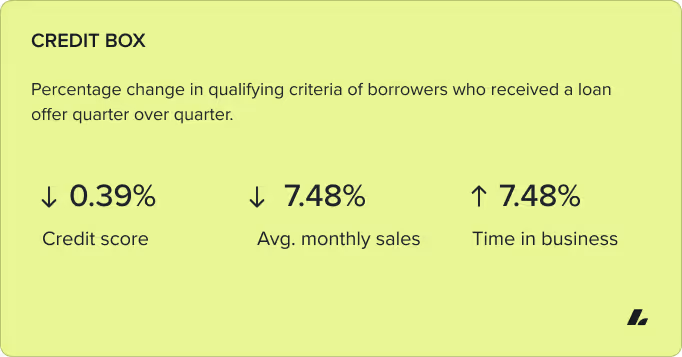
Lendio measures changes to borrowers’ qualifying credit score, monthly revenue, and time in business over a quarter period.
While all three factors of the credit box, such as average credit score, time in business, and monthly revenue eased this quarter, overall access to capital declined. This is driven by tightening across specific industries and heightened caution from lenders in key verticals. This suggests a more selective lending environment, with risk appetite dropping even as some criteria broaden.
Lender sentiment
Lender sentiment remained optimistic in Q2 2025, with most institutions continuing to project growth in small business lending—but with less momentum behind credit box expansion than in the prior quarter.
50% of lenders view an SMB’s ability to access capital in the current market as positive or very positive, while 29% viewed access as poor or very poor, and 22% remained neutral. This split suggests that while lenders generally view the market as accessible, there is lingering concern about risk and borrower readiness.
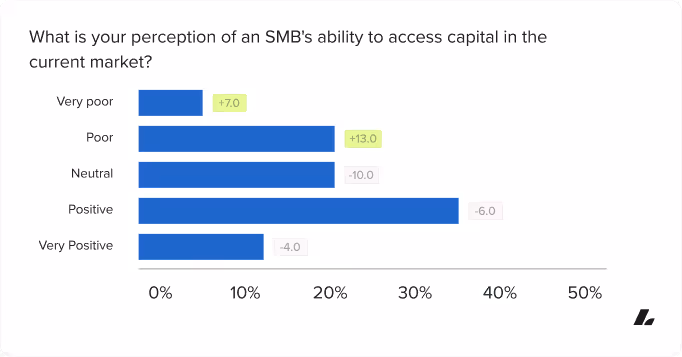
What is your perception of an SMB's ability to access capital in the current market?
Despite that caution, 72% of lenders expect to grow their SMB lending volume in the next quarter, and none reported plans to tighten their credit criteria. Instead, the majority (79%) anticipate keeping their credit box the same, while 21% expect to widen it.
This optimism is particularly strong among non-bank lenders, who see growing opportunity as traditional institutions pull back. Several lenders specifically pointed to revenue-based financing and digital working capital models as expanding channels to serve underserved SMBs.
“With traditional banks tightening their lending criteria, the landscape presents a strong and growing opportunity for the revenue-based financing sector to expand and meet the capital needs of underserved businesses.”
 Jay Avigdor, Velocity Capital Group
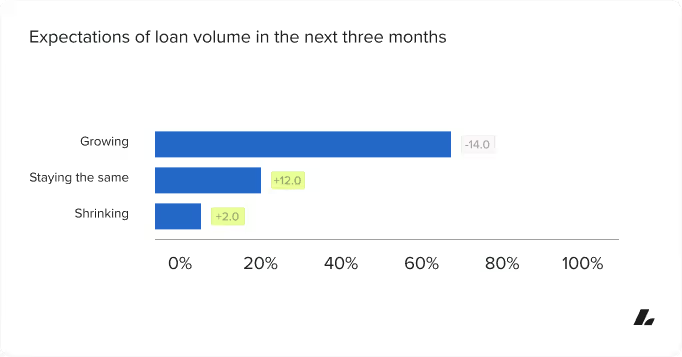
Expectations of loan volume in the next three months
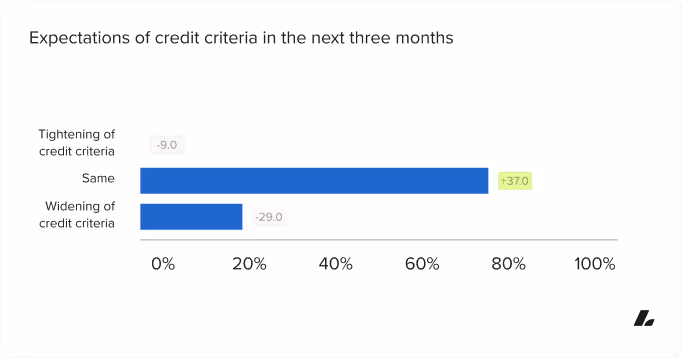
Expectations of credit criteria in the next three months
These figures reflect a cooling from Q1, when 50% of lenders projected credit box expansion. While fewer lenders are actively loosening requirements this quarter, the fact that no respondents anticipate tightening signals continued stability and borrower opportunity.
While lenders are not projecting tightening, some are proactively evolving their approach to risk. “We prioritize transparency and client confidence,” said Jay Avigdor of Velocity Capital Group. “Every transaction must be structurally sound, fully affordable and aligned with the client’s long-term financial health.”
Lender credit box adjustments
Throughout Q2 2025, Lendio tracked lender-reported changes to credit criteria to monitor shifts in underwriting behavior. Over the course of the quarter, tightening measures outpaced loosening, reflecting a cautious approach among lenders despite continued borrower demand.
Tightening actions included updates to:
- FICO minimums
- Industry eligibility
- Loan size ranges
- Loan term restrictions
In contrast, only two reported changes reflected loosening, involving:
- Longer loan terms
- Lower interest rate floors
While the volume of reported changes was modest, the directional trend points toward more conservative lending behavior—particularly in how lenders are managing borrower risk and sector exposure.
SMB sentiment
Lendio surveyed 1,800 small business owners to better understand the role financing plays in the success of their business, their experience with the current lending environment, and their expectations for the future.
The chart below illustrates how small business owners perceive access to capital over the next three months, revealing an optimistic majority.
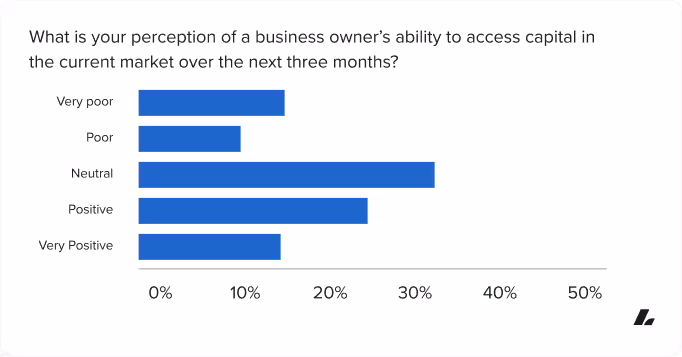
What is your perception of a business owner's ability to access capital in the current market over the next three months?
Among those reporting a negative sentiment (poor or very poor), most cited tightened loan approval requirements (75%) as the primary barrier, pointing to stricter credit standards, documentation hurdles, and less flexibility from lenders.
Half also pointed to the cost of borrowing as a concern, with elevated interest rates or unfavorable terms limiting their financing options. 32% of respondents cited broader economic conditions, underscoring the ongoing uncertainty shaping capital access perceptions.
For those small business owners with a positive sentiment (positive or very positive) easing approval standards were the top reason (68%), suggesting these business owners are experiencing greater lender flexibility or a more favorable application process. Additionally, 50% pointed to improving borrowing costs, and 34% felt economic conditions were trending in a direction that supports easier access to capital.
These findings reflect a bifurcated lending environment, where access to capital is improving for some, while others remain constrained by structural and economic challenges.
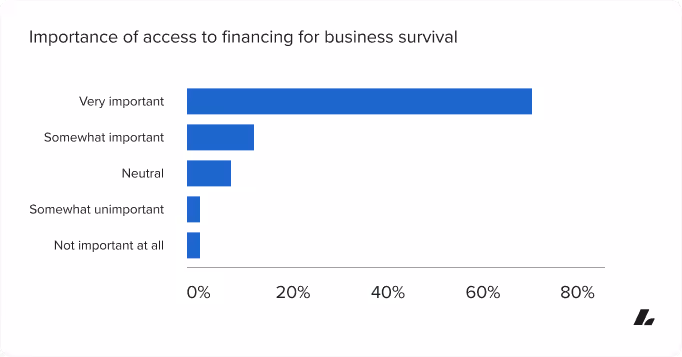
Importance of access to financing for business survival
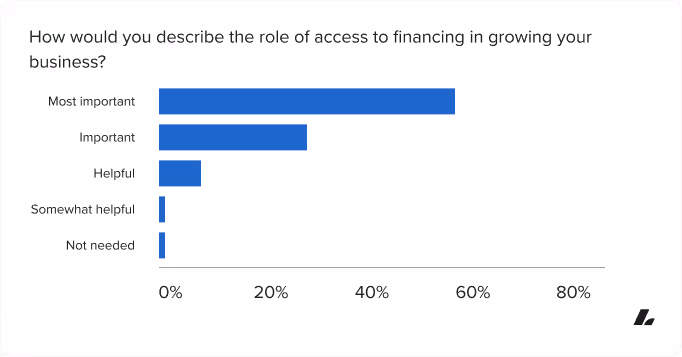
Importance of access to financing for business growth
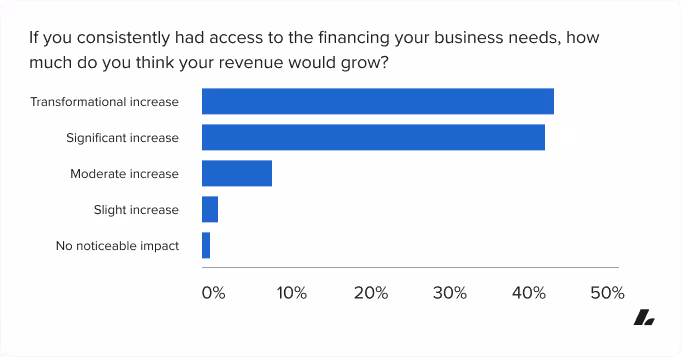
If you consistently had access to the financing your business needs, how much do you think your revenue would grow?
Access to capital remains a foundational concern for small business owners, both as a means of survival and as a pathway to growth. In Q2 2025, 73% of respondents said financing is very important to their business’s survival, and 60% named it the most important factor in driving growth. While both figures reflect a slight dip from Q1, the sentiment remains steady: the majority of SMBs rely on external funding to stay operational and pursue growth.
When asked how consistent access to financing would impact their revenue, 89% of respondents said it would result in a transformational or significant increase.
This overwhelming majority signals that capital constraints may be limiting growth potential for many SMBs—and that expanded access to funding could unlock meaningful business performance gains.
Industry analysis
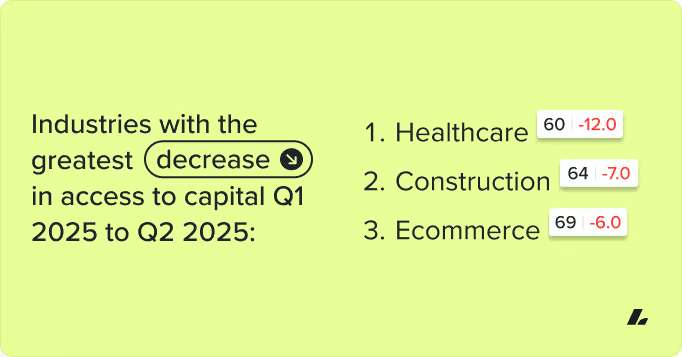
Three industries saw tightening qualification criteria quarter over quarter
Three industries saw loosening qualification criteria quarter over quarter
Compared to Q1 2025, the healthcare, construction and ecommerce industries experienced tightening credit standards, leading to decreased access to capital. Healthcare and construction remain below the national average access score for the quarter, as they did in Q1.
Retail, agriculture and forestry, and transportation experienced the greatest relaxation of credit standards, leading to increased access to capital. Agriculture and transportation sit well above the national average, while retail now aligns closely with the national benchmark.
Industry scores are calculated by taking the average credit score, time in business, and monthly sales of every business in that industry offered financing through Lendio’s marketplace in a given quarter. Higher scores indicate a lowering of requirements to qualify for funding, increasing access to capital. Lower scores indicate a tightening of requirements to qualify for financing, decreasing access to capital.
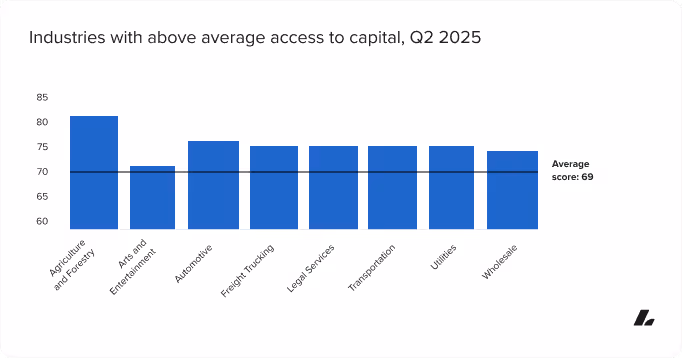
The number of industries with above-average access to capital declined from ten in Q1 2025 to eight in Q2 2025. Agriculture and forestry, arts and entertainment, automotive, freight and trucking, legal services, utilities, and wholesale remained above the national average for a second consecutive quarter. Transportation was the only new addition to the list this quarter, while ecommerce, information and media, and manufacturing shifted below the national benchmark in Q2.
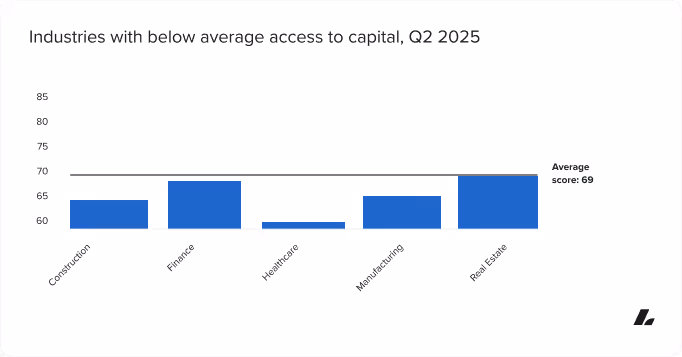
The number of industries with below-average access to capital decreased from six in Q1 2025 to five in Q2. Construction, finance, healthcare, and real estate remained below the national average for a second consecutive quarter. Manufacturing joined the list this quarter, while restaurants and retail moved to align with the national benchmark.
Industry credit criteria shifts
In Q2 2025, the national benchmark for average credit score, time and business, and revenue requirements generally decreased. At face value, this may suggest a loosening of lender credit boxes. However, access to capital declined, with more industries experiencing tightening conditions compared to the previous quarter.
This discrepancy highlights a more selective lending environment, where qualification thresholds may appear lower, but approval is increasingly reserved for stronger applicants. In practice, lenders are narrowing access by approving fewer businesses, despite broader criteria on paper. The shifts across industry vertical credit criteria are notable, particularly in qualifying credit scores.
Qualifying credit scores tightened in every industry
In Q2 2025, every one of the 18 industries measured saw an increase in the average credit score among funded businesses. This trend indicates a consistent tightening of standards across the board, with lenders favoring applicants with stronger credit profiles.
The most significant increases occurred in:
- Restaurants - (+10.0)
- Wholesale - (+5.0)
- Finance - (+4.0)
Even industries with minimal change, such as ecommerce (+0.4), show movement towards higher qualification thresholds. While the increases may vary in scale, the direction is uniform, suggesting a higher baseline for approval in all sectors.
This consistent rise in average credit scores implies lenders are approving applicants with stronger credit histories, narrowing the pool of fundable businesses. Rather than expanding access, this shift reflects increased caution in underwriting, particularly in industries with perceived volatility or risk.
Time in business was mixed
Unlike credit scores, time in business trends varied significantly across industries in Q2 2025, with some sectors experiencing tighter requirements, while others saw easing.
Industries with notably higher time in business among approved borrowers included:
- Wholesale (+26.0)
- Real estate (+21.0)
- Transportation (+19.0)
These increases suggest lenders are placing greater emphasis on business longevity in certain verticals, favoring applicants with an extended operational history.
Conversely, a few industries saw meaningful declines in time in business requirements:
- Utilities - (-27.0)
- Freight/ Trucking - (-11.0)
- Healthcare - (-3.0)
These reductions may reflect efforts to stabilize lending portfolios or support growth in strategically important sectors by extending credit to younger businesses.
While time in business requirements loosened in select industries, the broader lending environment continues to prioritize maturity and operational track record, particularly in capital-intensive or higher risk sectors.
Revenue requirements are sharply divided
In Q2 2025, average monthly revenue requirements showed significant divergence across industries, reflecting lenders’ efforts to calibrate risk by sector.
Industries with higher revenue expectations included:
- Real estate - (+37.0)
- Wholesale - (+24.0)
- Arts/entertainment - (+22.0)
These increases suggest lenders are raising the bar for revenue performance in sectors with strong recent growth or high capital needs, requiring businesses to demonstrate greater financial resilience before securing funding.On the other hand, several industries with lower revenue thresholds:
- Retail - (-36.0)
- Utilities - (-12.0)
- Transportation - (-9.0)
These reductions may reflect lender efforts to maintain deal flow in slower-growth or price-sensitive sectors, where relaxing revenue requirements could support borrower retention or broaden the eligible pool.
Taken together, these shifts underscore a more nuanced approach to underwriting—one that considers sector-specific performance and risk tolerance, rather than applying uniform criteria across the board.
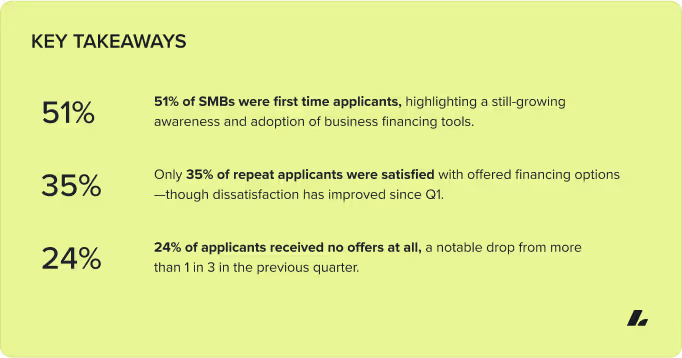
Key Takeaways
While average borrower requirements appeared to loosen across all three metrics in Q2 2025, industry-level data tells a more nuanced story. Credit score requirements tightened across all industries, time in business trends favored more mature businesses, and revenue expectations diverged sharply based on sector performance. These shifts point to a more selective lending environment, one where lenders are refining credit boxes by industry and borrower profile, narrowing access to capital despite broader average trends.
Lender perspective
Lender commentary gathered during the quarter reinforces this more selective lending environment. Lenders noted that credit policy adjustments are increasingly industry-specific, tightening in sectors impacted by tariffs, regulatory uncertainty, or macroeconomic risk, while loosening in areas with growth potential. “We will be tightening on some industries related to the tariffs with China,” said Jake Lerner of Revenued, “but opening up our credit box in other areas, creating a net neutral effect.”
Others emphasized that estimating credit box changes has become more difficult amid ongoing economic volatility. Credit criteria are being adjusted dynamically, often multiple times within a quarter, in response to evolving market conditions. This fluid approach to underwriting may explain why average qualification metrics appear looser, even as access to capital tightens in practice.
Regional analysis
Lendio conducted a regional analysis of the data to uncover trends in the Northeast, Midwestern, Southern, and Western regions, according to Census regional divisions of the United States.
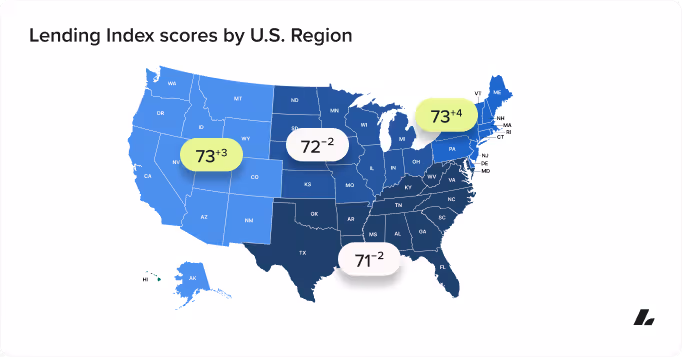
Northeast: 73 | +4
The Northeast region saw an increase in access to financing in Q2 2025, with the regional average rising by four points. Seven of the nine states in the region scored above the national benchmark, making a notable improvement from the previous quarter.
Rhode Island led the region with an 11-point gain—the highest among Northeastern states—followed by Pennsylvania (+7), Maine (+9), New York (+4), and Connecticut (+3). These gains signal expanding financing availability across much of the region.
Midwest: 72 | -2
The Midwest region experienced a decline in access to financing in Q2 2025, with the regional average dropping three points from the previous quarter. South Dakota saw the steepest decline, falling 21 points and now well below the national average. Nebraska (-6), Ohio (-5), Minnesota (-3), Missouri (-3), and Kansas (-3) also contributed to the regional dip. North Dakota led the region in gains, increasing five points, followed by Iowa (+3) and Wisconsin (+4). Despite several states holding steady or improving, the regional trend reflects tightening access to capital in much of the Midwest.
South: 71 | -2
Southern states saw a slight decline in access to financing in Q2 2025, with the regional average dropping two points from the previous quarter. Texas experienced the most significant decrease, falling 13 points, followed by Florida (-11), and Georgia (-5). Despite the broader regional dip, several states posted gains, including Tennessee (+6), Arkansas (+4), Mississippi (+3), and Louisiana (+3). The South remains mixed in terms of capital accessibility, with stronger performance concentrated in parts of the Southeast and weakening access in larger markets like Texas and Florida.
West: 73 | +3
The West region saw an improvement in access to financing in Q2 2025, with the regional average rising three points. Idaho led all Western states with a 14-point gain, followed by strong increases in Hawaii (+12), Montana (+11), and Oregon (+6). These gains contributed significantly to the region's upward trend.
Other notable risers included Utah (+5), California (+1), and Colorado (+1). Meanwhile, Wyoming (-6), Alaska (-7), Nevada (-2), and New Mexico (-2) saw declines in access, tempering some regional gains.
Overall, the West showed broad improvement, driven by double-digit gains in several Mountain and Pacific states.
The lending experience today
First time vs. returning applicants
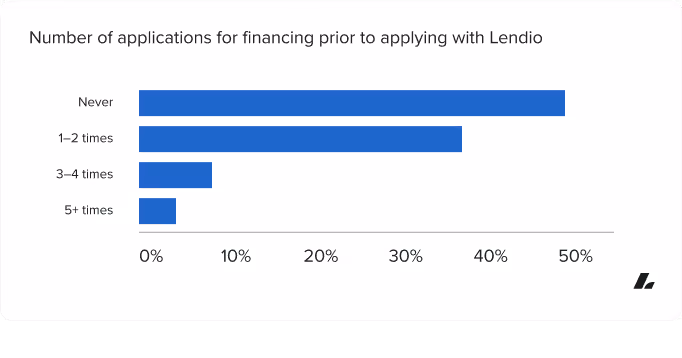
For many small business owners, applying for financing is still a relatively new experience. 51% of respondents said they had never applied for business financing before working with Lendio. The remaining 49% had applied at least once before, with a majority of those having applied 1-2 times.
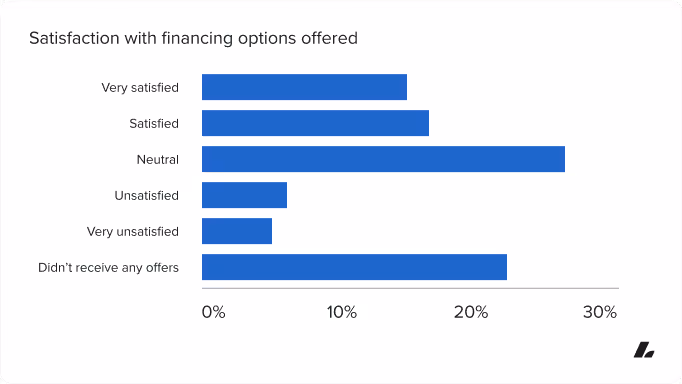
Satisfaction with financing options
Among those who had applied before, satisfaction with previous financing experiences was mixed. Only 35% were satisfied or very satisfied with the options they were offered, while 28% gave a neutral rating. Nearly 1 in 4 reported receiving no offers at all. However, that figure—24%—represents a meaningful improvement from Q1, where more than one in three applicants said the same.
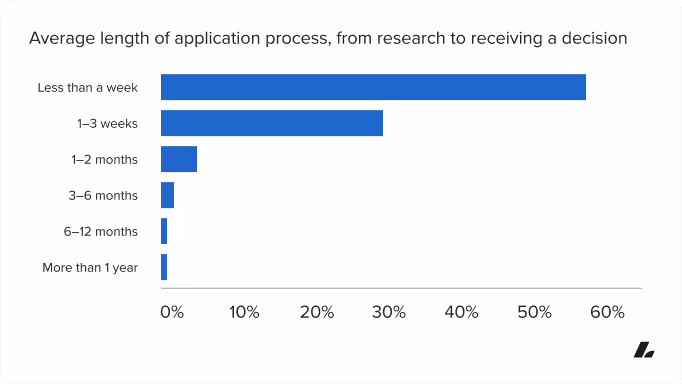
Speed of funding
While many SMBs have struggled to find financing in the past, the application process itself has become increasingly efficient. Among those who had previously received funding, 60% said the process from initial research to final decision took less than a week. Another 31% reported a timeline of one to three weeks, indicating that fast turnarounds are becoming more common.
However, rapid application timelines do not necessarily equate to higher satisfaction across all stages of the lending process. Most applicants were satisfied with the time it took to complete the application itself, but satisfaction dropped in later stages, particularly around meetings with funding experts, receiving a decision, and finalizing agreements. The step with the lowest satisfaction was receiving a funding decision, with only 34% experiencing satisfaction.
Funding outcomes
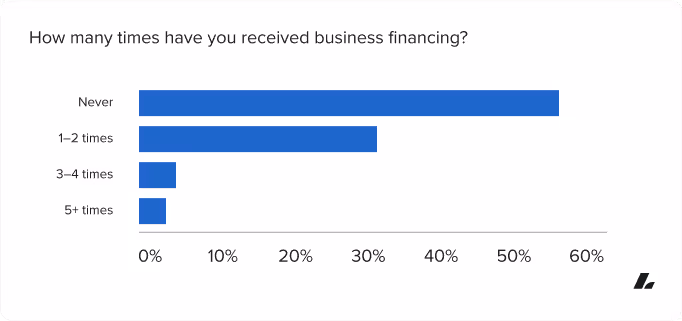
Looking at funding outcomes, 58% of respondents reported never receiving business financing.
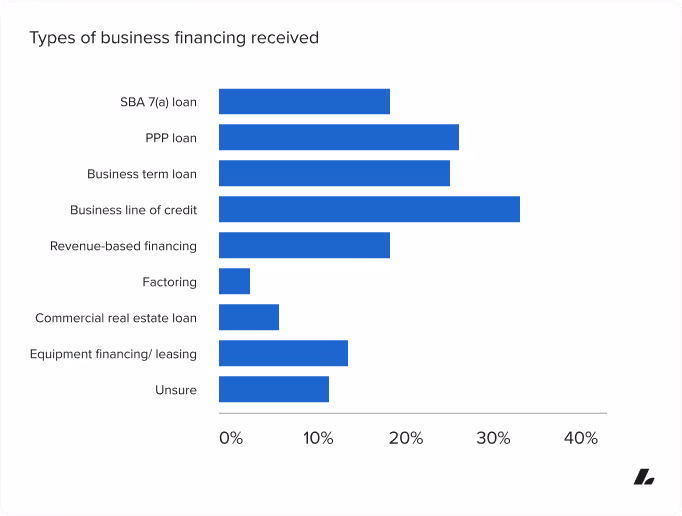
Among those who had historically received funding, the most common products received were business lines of credit, PPP loans, term loans, and SBA 7(a) loans.
Digital-first preferences reflect the modern lending landscape
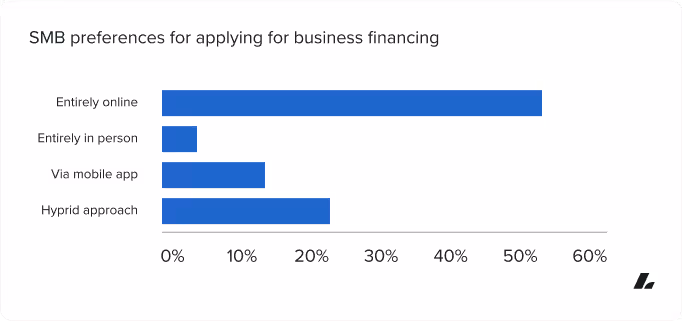
As small business lending continues to shift toward faster, more streamlined processes, borrower preferences are clearly aligned with that trend. A majority of SMBs (55%) say they prefer to apply entirely online via desktop or laptop, while 24% favor a hybrid model that blends digital and in-person interactions. Just 6% preferred a fully in-person experience.
These preferences reflect the broader direction of the market: small business owners are embracing digital lending solutions that offer convenience, transparency, and speed. Still, as earlier findings show, even digital-first borrowers export more than fast applications. They want better quality offers, responsive support, and funding timelines that match the urgency of their needs.
What SMBs want: lending preferences and priorities
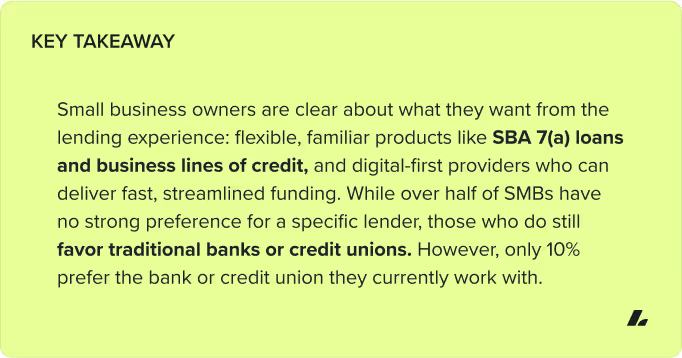
Small business owners aren’t just seeking access to capital. They’re also clear on the types of financial products, providers, and messaging that resonate with them most.
Preferred financing product types
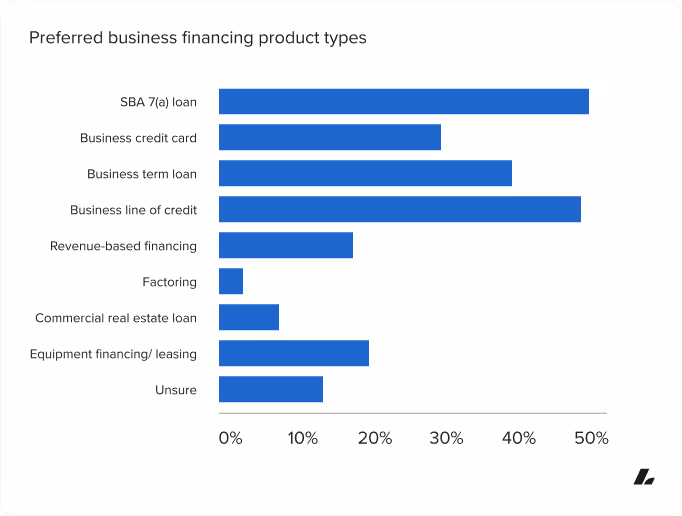
When asked to select which types of business financing they would prefer to receive, SMBs indicated SBA 7(a) loans (52%) and business lines of credit (51%) were the most favored products. The preference for SBA 7(a) loans isn’t a surprise when taking in the broader trends of lending in Q2 2025. As Jon Kleven of Monarch Commercial Capital put it, “SBA has always been the conduit for financing when conventional financing tightens up,” reflecting the program’s long-standing role in filling credit gaps during uncertain cycles.
Term loans (41%) and business credit cards (31%) followed, indicating that SMBs are looking for flexible, working capital solutions alongside long-term funding vehicles with favorable terms.
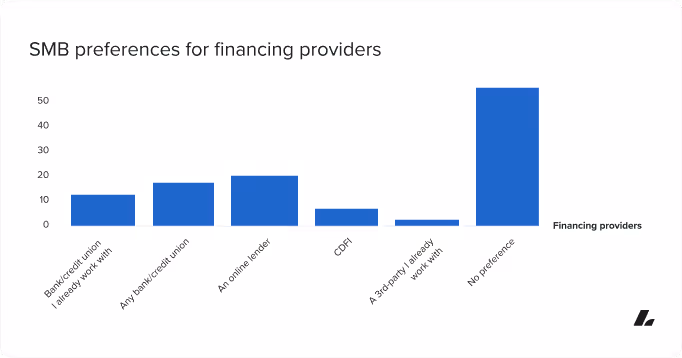
A noncommittal approach to providers
When it comes to where they want to get financing, most small business owners (53%) said they have no strong preference, signaling an openness to various lenders. Among those who expressed a preference, traditional banks or credit unions (25%) led, followed by online lenders (17%). Of those who indicated preference for banks or credit unions, only 10% preferred to work with a bank or credit union they already use.
Messaging that drives action
When asked what type of advertising would encourage them to apply for financing, SMBs overwhelmingly prioritize personalized, results-oriented messaging. The top responses were:
- Funding amount pre-approvals (33%)
- Fast approval and funding (32%)
Messaging focused on how funding works, how fast it’s delivered, and how much the borrower might receive resonates more strongly than general branding or testimonials.
The financial literacy gap
While many small business owners take a proactive approach to researching financing, a sizable portion still struggle to navigate the process with full confidence. The result is a growing need for educational tools, expert guidance, and clearer, more accessible content.
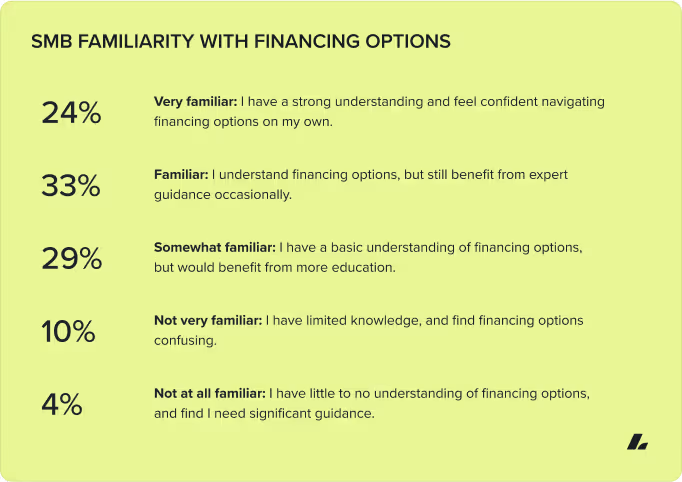
Familiarity with financing options
When asked about their familiarity with small business financing, only 24% of SMBs said they feel very confident navigating their options independently. The majority (62%) reported some level of familiarity, but still benefit from guidance.
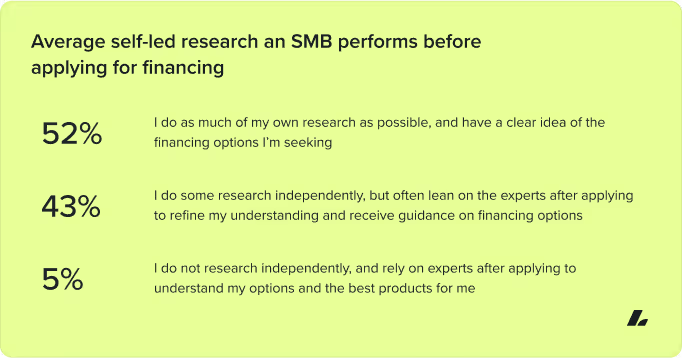
Self-led research and education
Most business owners are doing their homework before applying. 52% said they research as much as possible before applying and come in with a clear sense of what they’re looking for. Another 43% do some initial research but rely on experts after applying to refine their options. Only 5% said they rely entirely on post-application guidance.
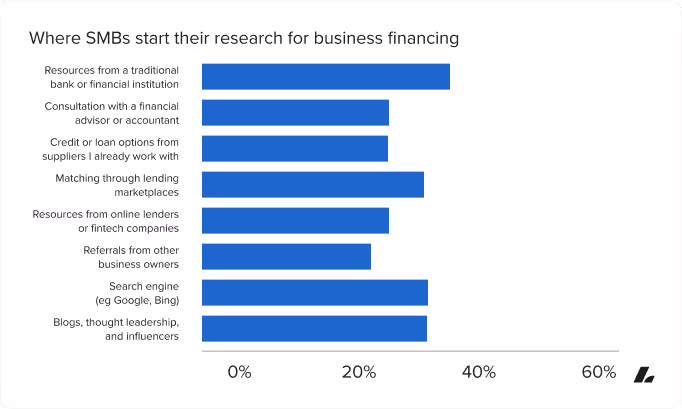
When business owners realize they need financing, their first stop is often the internet. The top three research sources were:
- Traditional bank or financial institution resources - 36%
- Search engines - 34%
- Blogs, thought leadership, and influencers - 34%
Matching services, online lender content, and referrals from other business owners also ranked highly, reinforcing the role of both institutional and independent voices in shaping early-stage decision-making.
In addition to more formal research channels, a growing number of small business owners are getting their financial education from social media and even AI. Among 95 open-ended responses provided, Youtube was the most frequently mentioned, followed by ChatGPT, and then TikTok influencers.
Other platforms like Instagram, LinkedIn, Reddit, and Facebook were noted less frequently, along with individual influencers and niche communities. While smaller in volume, these responses highlight the growing role of peer-driven content, social platforms, and AI tools in helping SMBs explore financing—particularly among newer or digitally native entrepreneurs.
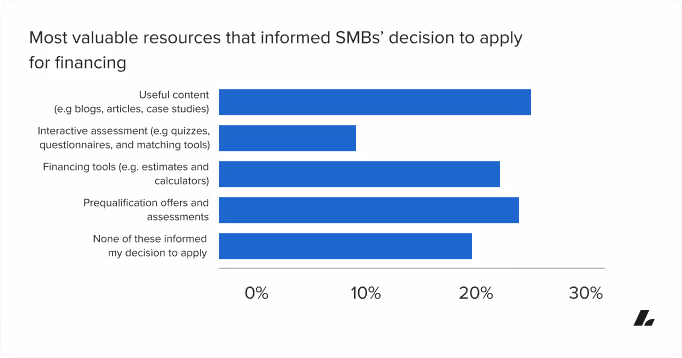
When it comes to making the leap from research to action, the most valuable tools were:
- Useful content like blogs and case studies -25%
- Prequalification offers - 24%
- Financing calculators and estimate tools -22%
Interactive tools and quizzes played a smaller role (9%) while 1 in 5 respondents said none directly influenced their decision. Relevance and timing are key to making financing educational content effective.
A disconnect in banking relationships
While many small business owners maintain deposit accounts with traditional banks or credit unions, those relationships don’t always extend to lending. A growing number of SMBs report unmet credit needs, and many are open to moving their deposits in search of better financing access.
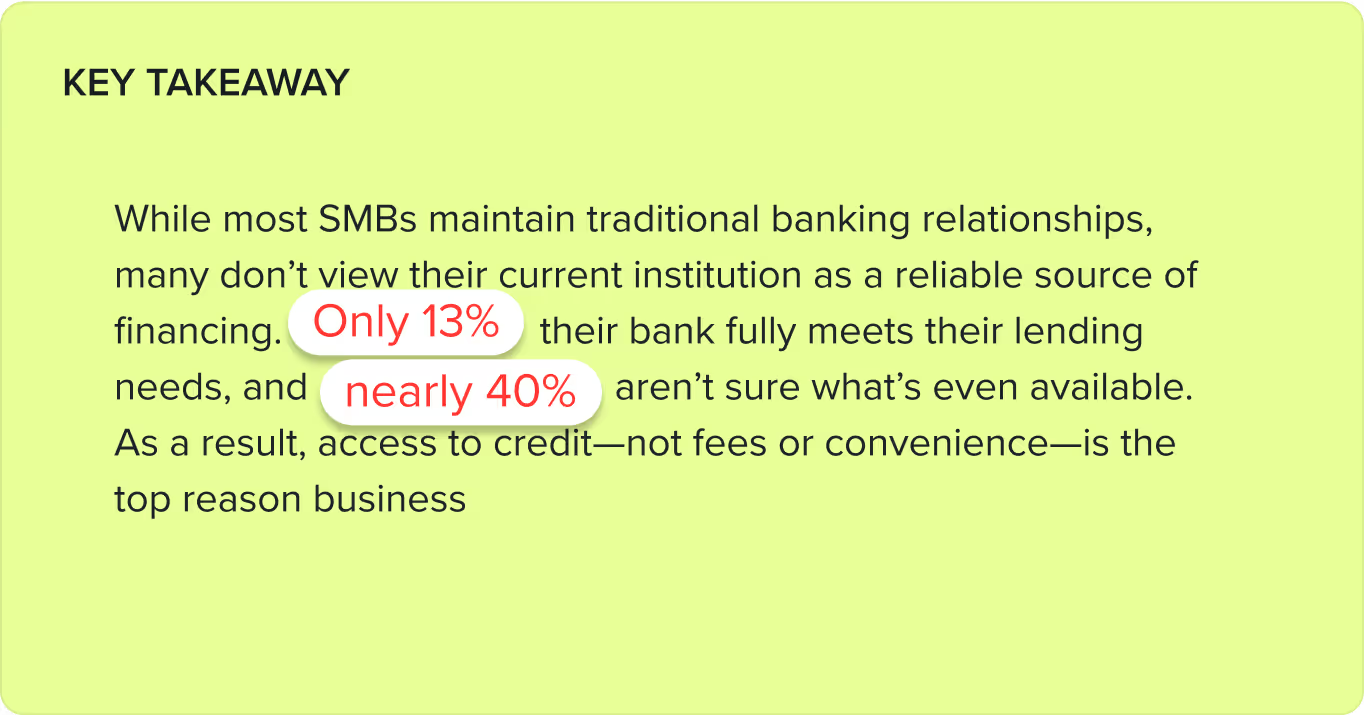
When asked whether their current bank meets their business financing needs, only 13% of SMBs said their bank has loan options that meet all their needs. 39% weren’t sure of what their bank even offers in terms of financing options.
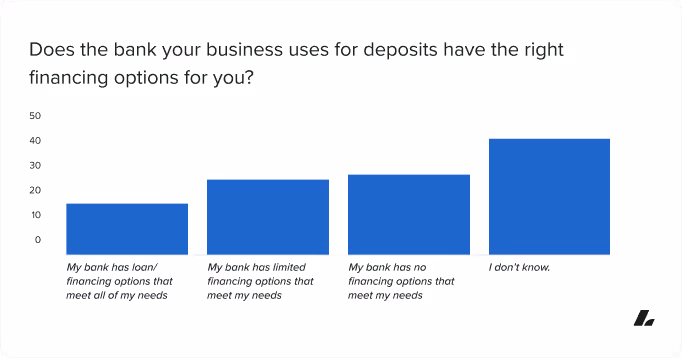
This lack of awareness or access underscores a disconnect between where SMBs bank and where they can actually secure funding.
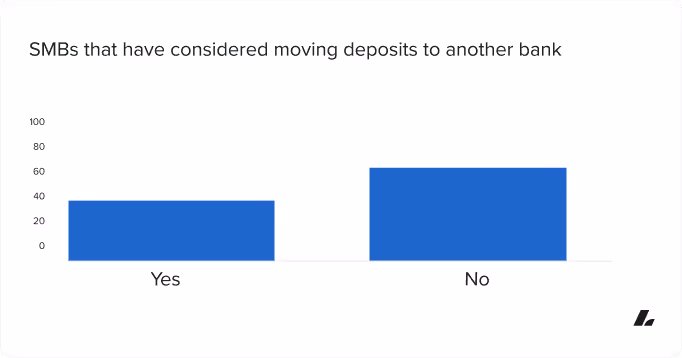
39% of SMBs said they’ve considered moving their deposits to another bank. Among them, the top reason was unmet business lending needs (43%), surpassing concerns about fees, customer service, and digital banking experience.
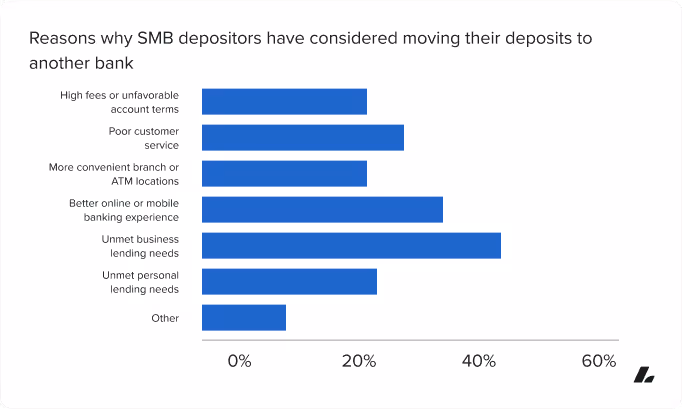
Notably, many open-ended responses (Other) reflected frustration with bank fraud issues, limitations of digital-only banking, slow approvals, and a general sense that “my bank doesn’t support small business.”
What would motivate a future move
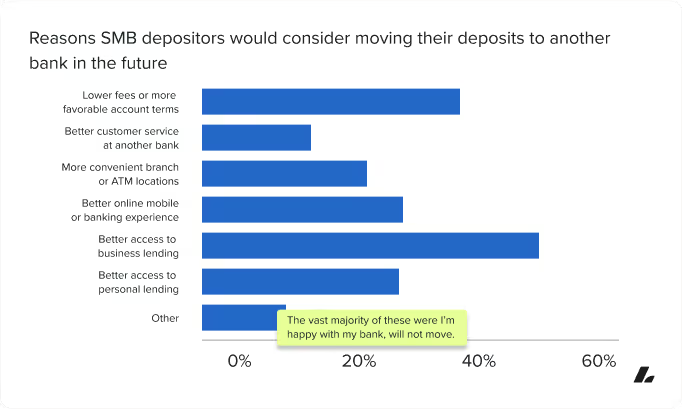
Looking ahead, better lending access continues to top the list of reasons SMBs would consider switching banks:
- 51% cited better business lending access as a motivator
- 37% said lower fees
- 27% wanted better online/mobile tools
These findings reinforce the opportunity for banks to compete—not just on service or convenience, but by actively addressing SMB credit needs.
Methodology
To calculate the score, Lendio pulls the average credit score,* monthly revenue, and time in business of every company that received a financing offer through our marketplace in the given time frame of April 1, 2025 - June 30, 2025.
These averages are then compared against a framework developed by historical averages at times of lower and higher credit requirements. The framework is also adjusted based on changes in the overall borrower mix. The top 95th percentile was removed from time in business, and average monthly revenue, to eliminate outliers relative to the population being measured in industry and region. Average monthly revenue is adjusted for inflation using data from the Bureau of Labor Statistics. The final score is the average of the three scores calculated for credit score, monthly revenue, and time in business. Calculations for this quarter’s report were based on a regional analysis of 14,147 distinct borrowers, and an industry analysis of 14,271 distinct borrowers.
Survey
In May 2025, Lendio surveyed 14 lenders, including banks and online lenders, and 1,800 small business owners, to gauge their sentiment towards the current small business lending market.
*Credit score averages are based on businesses’ selfreported credit scores from the respective populations of 14,147 borrowers by region, and 14,271 borrowers by industry.
FAQs
The information provided on this blog is for general informational purposes only, and should not be construed as business, legal, tax, accounting or financial advice. Readers should consult with a qualified professional before making any business, financial, or legal decisions. The views and opinions expressed in this blog are solely those of the authors and do not necessarily reflect the official policy, position, or endorsements of Lendio. While Lendio strives to keep its content current, it is accurate only as of the date posted. Business trends, financial conditions, regulations, and offers are subject to change without notice and may no longer be relevant or available. Lendio expressly disclaims all liability for any reliance placed on this information. By accessing this blog, you acknowledge and agree that Lendio shall not be held liable for any direct, indirect, incidental, consequential, or other damages arising from your use or reliance on the information provided.
Quickly compare loan offers from multiple lenders.
Applying is free and won’t impact your credit1.